Chargement de la page…
The ROI of a single unit is not enough to compare two purchases: you also need to track how much capital remains committed, and for how long. Build a cohort using actual cash outflows, units received, units sold out, net cash inflows, and their dates. Show the estimated ROI alongside a curve of unrecovered capital, without mechanically multiplying a return by an assumed number of turns. A planned sale is not a cash receipt. Test a central scenario and a slower scenario, then replace the assumptions with the account's actual reports. The best opportunity then depends on cash flow, risk, and time — not on an isolated percentage.
Static ROI and the calendar answer two different questions
The ROI of a product scenario compares an estimated profit to a capital base defined as committed. It answers "what return for this base?" Turnover answers "at what pace do units sell out?" The cash-flow calendar answers yet another question: "when are outflows actually offset by cash inflows that are available?"
Merging these three notions creates shortcuts. One batch can show a high per-unit ROI while still sitting in stock for a long time. Another can have a more modest margin but free up capital quickly. No single indicator decides on its own, without the seller's constraints.
The guide ROI or net margin on Amazon defines the denominators. Here, tied-up capital is a scenario-tracking metric: it must be explicitly defined and must not be presented as a universal accounting category.
Mapping a cash-flow cohort
| Event | Amount | Date | Effect on the scenario's capital |
|---|---|---|---|
| supplier deposit | observed | debit date | increases committed capital |
| purchase balance | observed | debit date | increases committed capital |
| shipping and prep | observed or estimated | payment date | increases committed capital |
| stock received | quantity | receipt date | changes status, not necessarily cash |
| sale | quantity and revenue | order date | signal, not yet an available receipt |
| net payout | observed | availability date | reduces unrecovered capital per the rule |
| return or adjustment | observed | movement date | can increase or reduce the balance |
The definition must specify whether overheads, taxes, reserves, or payout delays are included. Two charts are only comparable if their scope is identical.
Four-step procedure
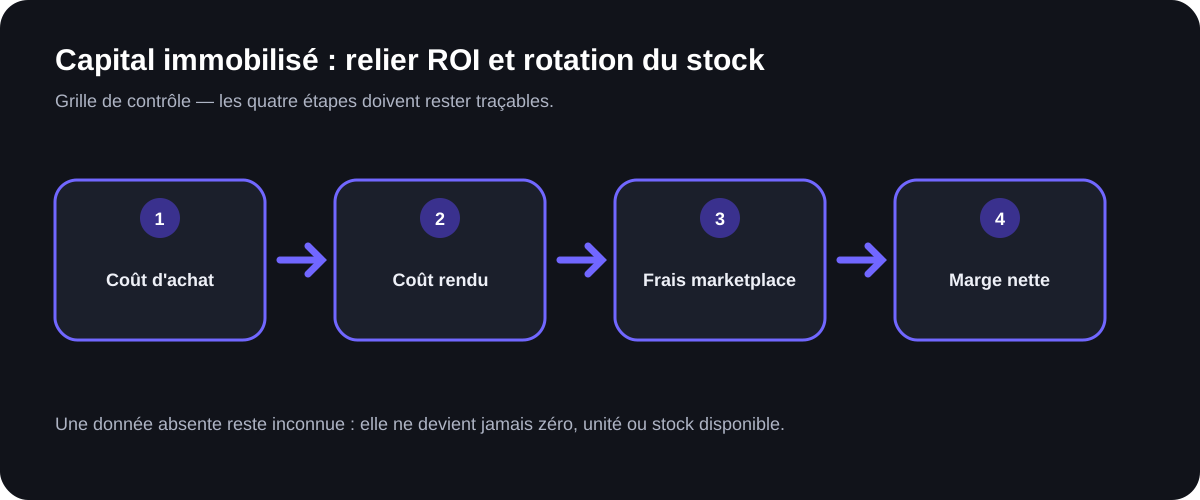
1. Record the cash outflows
Start from the payments, not just the final invoice. A deposit ties up cash before receipt. Keep the currency, the exchange conversion, payment fees, and the date. Estimates stay flagged until the actual debit happens.
2. Model the physical outflows
Build a scenario per period with units sold, returned, lost, or remaining. The sum of outflows never exceeds available stock. A unit transferred between warehouses is not a sale.
3. Model the net cash inflows
Use the account's actual payout calendar when available. For a new product, enter an explicit delay assumption. Do not treat revenue at order time as already recovered cash if the model is about cash flow.
4. Reconcile and compare
Replace estimated sales, fees, returns, and payouts with observed data. Compare scenario curves that share the same scope. Also analyze remaining stock and storage costs.
Hypothetical example of gradual recovery
The following figures are fictional and represent no actual Amazon performance. Suppose a seller commits 1,000 euros to an educational cohort. The central scenario projects three hypothetical net payouts of 400, 400, and 350 euros on successive dates.
Unrecovered capital after each payout, before any other adjustment, is:
- start: 1,000 euros;
- after the first payout: 600 euros;
- after the second: 200 euros;
- after the third: zero, then a surplus of 150 euros.
The slower scenario keeps the same total amounts but pushes back the payouts. The final hypothetical profit does not change, while the time the capital stays tied up increases. If the extra time generates storage, returns, or a price drop, the profit must also be recalculated. This example shows why the final ROI does not tell the story of the path taken.
Storage cost must stay visible
Amazon states that using FBA can lead to storage fees and other inventory-related fees. A slow turnover can therefore affect two axes at once: capital stays committed, and the direct cost evolves. The article on FBA storage over time details cohorts and dated rules.
Do not reduce these two axes to an arbitrary "cost of capital" if the seller has not defined that assumption. First, show the unrecovered euros and the days elapsed in the scenario. If an actual financing cost exists, add it from the relevant contract or statement.
Why annualizing is dangerous
Multiplying an ROI by a theoretical number of turns assumes the same products, prices, fees, delays, and quantities repeat without interruption. This assumption is rarely proven before the first batch. Annualizing can be an internal scenario, but it must expose every one of these conditions and must not be presented as an expected return.
A more robust comparison shows: per-unit ROI, profit per unit, maximum capital committed, the hypothetical recovery date, remaining stock at several dates, and an unfavorable scenario. The simulation of an Amazon price drop complements this reading by testing whether recovery holds up under lower revenue.
What ArbitragePro+ can automate / what the seller must verify
The simulateur-capital function is a proposed specification, not a confirmed feature. It could link cash outflows, cohorts, physical outflows, and cash inflows, show unrecovered capital, and compare several calendars. It should distinguish orders, planned payouts, and actual payouts.
The seller must confirm the capital scope, the account's payout delays, the costs, and the sales scenarios. They decide on the acceptable cash-flow level and check the actual movements. The tool cannot guarantee a turnover rate or repeat a future ROI.
Checklist before ranking opportunities
- The ROI denominator is defined.
- Every cash outflow has a date and a status.
- Physical outflows stay distinct from cash inflows.
- Payout delays are observed or explicitly assumed.
- Remaining stock is visible for each period.
- Storage and returns are recalculated as time passes.
- The slow scenario promises no sale.
- Any annualization exposes all of its assumptions.
- Actual data gradually replaces the scenario.
Official sources
- Amazon France, Fulfillment by Amazon and storage information: https://sell.amazon.fr/expedie-par-amazon — accessed 2026-08-17.
- Amazon France, fees and additional inventory-related costs: https://sell.amazon.fr/tarifs?lang=fr-FR — accessed 2026-08-17.