Chargement de la page…

Use ROI to compare the efficiency of capital employed, and estimated net margin to measure the share of revenue that remains after the costs included in your model. Neither filter is sufficient on its own. A high ROI can hide a profit per unit that's too low or slow turnover; a good margin can require too much cash. Always define the numerator, the denominator, the cost scope, and the tax base before comparing two products. In practice, first filter out data errors and loss-making scenarios, then display profit per unit, ROI, margin, and capital employed side by side. The final decision must still factor in demand, risk, lead time, and operational capacity.
Two different questions, two denominators
ROI answers the question: "how much estimated profit does this scenario produce per unit of capital employed?" Using a simple, explicit convention:
Estimated ROI = estimated profit / capital employed × 100
The scenario's estimated net margin answers a different question: "what share of comparable revenue remains after the costs my model includes?" One possible convention is:
Estimated net margin = estimated profit / comparable revenue × 100
These formulas only become comparable once their terms are comparable. "Capital employed" can be limited to the landed cost of the inventory or include other outlays up to the sale. "Comparable revenue" must be defined on a consistent tax base. "Estimated profit" must list the costs subtracted. There is no universal percentage that automatically corrects a poorly defined scope.
The term "net margin" is used here as a product-scenario indicator, not as the company's accounting net result. Salaries, subscriptions, financing, taxes, and overhead only appear in it if the seller chooses to allocate them and documents that rule. Without this clarification, two teams can display the same percentage while talking about different realities.
Why Amazon fees must be updated before filtering
Amazon publishes pricing that distinguishes categories and several fee families. The official page also states that FBA fulfillment fees can depend on the product's type, dimensions, and weight. The FBA page offers a revenue calculator to compare FBA and other fulfillment methods based on product details and shipping costs.
A filter calculated with an assumed category, an old size tier, or an approximate weight gives misleading precision. Before ROI and margin, therefore, stabilize the full Amazon landed cost. Values from the calculator remain dated estimates; account reports and invoices will then allow reconciliation.
Seven-step comparison procedure
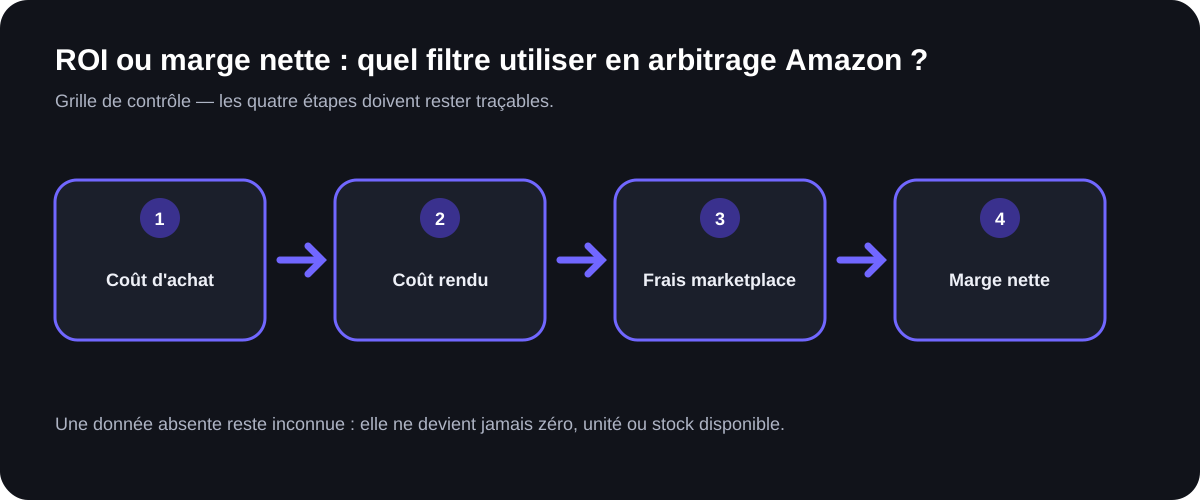
1. Set the scope. Write down the costs included in the estimated profit and those left out of the model. 2. Normalize the bases. Use a consistent currency and tax base for revenue, costs, and capital. 3. Build the landed cost. Include the purchase and the costs needed to make the unit sellable, with a traceable allocation of supplier freight. 4. Create a selling scenario. Select the logistics mode and the current Amazon fees corresponding to the product. 5. Calculate the profit per unit. Comparable revenue minus all costs within the scope. 6. Calculate both ratios. Use exactly the same profit in the numerator, then display the denominators. 7. Add the constraints. Lead time, estimated turnover, minimum order quantity, return risk, and data quality must remain visible separately.
A filter must not remove lines missing a critical piece of data. It should place them under review instead. Replacing an unknown fee with zero artificially inflates both ratios. A range is more honest: central scenario, unfavorable scenario, and, if useful, favorable scenario, each carrying its own assumptions.
A hypothetical example: same euros, different readings
All the figures below are educational assumptions, unrelated to any real Amazon rate, tax situation, or opportunity. Assume two scenarios on the same base:
| Assumption | Product A | Product B |
|---|---|---|
| capital employed per unit | €20 | €35 |
| comparable revenue | €27 | €45 |
| other scenario costs | €2 | €3 |
| estimated profit | €5 | €7 |
| estimated ROI | 25.0% | 20.0% |
| estimated net margin | 18.5% | 15.6% |
For A, the profit is 27 − 20 − 2 = €5. Its ROI is 5 / 20 = 25%. Its estimated margin is 5 / 27, or about 18.5%. For B, the profit is 45 − 35 − 3 = €7; the ROI is 7 / 35 = 20% and the estimated margin 7 / 45, or about 15.6%.
Here, B generates more euros per unit, while A employs capital more efficiently within the limits of the example. You cannot choose without volume, turnover, cash, and risk. If B sells much faster or requires less work, its higher profit per unit may be relevant. If capital is scarce and turnover speeds are the same, A may take priority. These conclusions are conditional; the example recommends no threshold.
When to favor each filter
| Decision situation | Indicator to look at first | Essential complementary check |
|---|---|---|
| limited cash | estimated ROI | profit per unit, lead time, and turnover |
| pressure on the selling price | estimated net margin | breakeven threshold and scenario range |
| high minimum order quantity | total capital employed | ROI, sell-through, and stock risk |
| high operating cost per order | profit per unit | margin, volume, and processing time |
| uncertain fee data | no definitive ranking | fill in or bound the unknowns |
Margin helps observe the scenario's ability to absorb a revenue drop, but it does not replace calculating the breakeven resale price. ROI shows a static capital efficiency; it does not naturally factor in duration. Two identical ROIs achieved over very different timeframes are not equivalent. However, avoid annualizing an assumed turnover rate without reliable data: that would turn a fragile assumption into a spectacular figure.
What ArbitragePro+ can automate / what the seller must verify
The roi-margin-filter function is a proposed specification and not a function announced as present in the application.
| Proposed automation for ArbitragePro+ | Verification that remains with the seller |
|---|---|
| calculate ROI, margin, and profit with displayed formulas | validate the cost scope and the tax base |
| show the capital and revenue used as denominators | confirm the values are comparable across products |
| flag missing or outdated fees | check current Amazon rate cards and reports |
| compare several price and cost scenarios | judge whether the unfavorable assumptions are realistic |
| rank by the chosen filter without hiding the other metrics | factor in turnover, cash, returns, and business constraints |
Good automation explains the ranking. It should let you trace back from each ratio to its inputs, silently drop no cost, and distinguish observed value from assumed value. The seller keeps the purchase decision: a numeric signal is neither a sales guarantee nor a promise of revenue.
Checklist before sorting opportunities
- Estimated profit uses the same scope for every line.
- Capital employed and comparable revenue are displayed.
- Category, dimensions, weight, and logistics mode are confirmed.
- Amazon fees come from a current, dated source.
- Assumptions are not replaced with zeros.
- ROI, margin, and profit per unit remain visible together.
- Lead time, turnover, and minimum order quantity are not buried in a ratio.
- An unfavorable scenario is calculated before any order.
Official sources
Sources accessed August 17, 2026:
- Amazon France — rates and selling fee families
- Amazon France — Fulfillment by Amazon and Revenue Calculator
- EUR-Lex — Directive 98/6/EC on the indication of prices offered to consumers
Review opportunities with their assumptions
View available supplier–Amazon opportunities in ArbitragePro+